
See the year ahead, month by month.
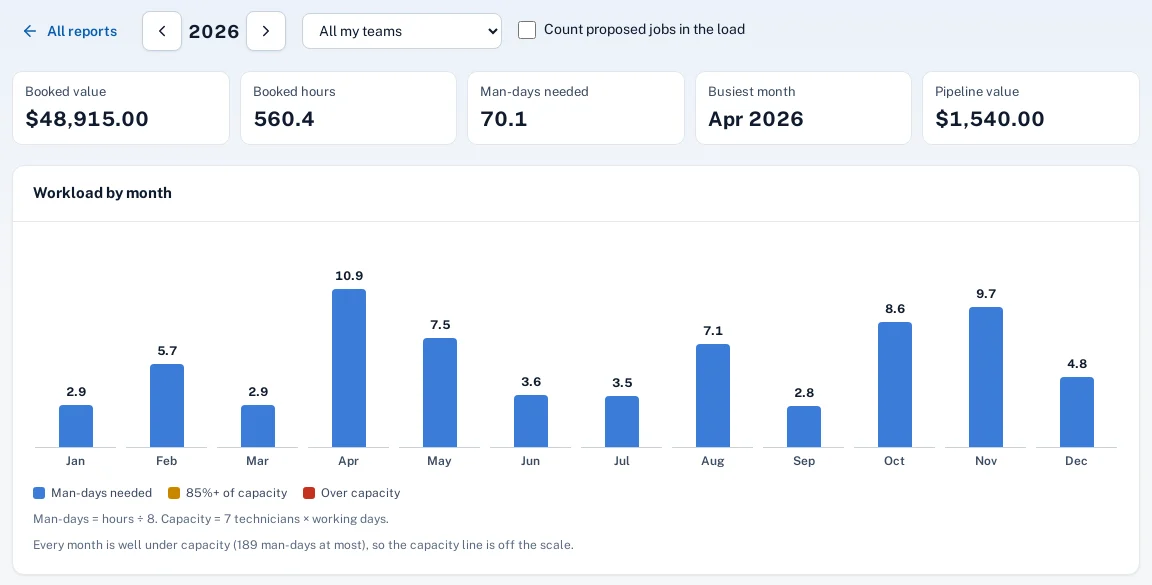
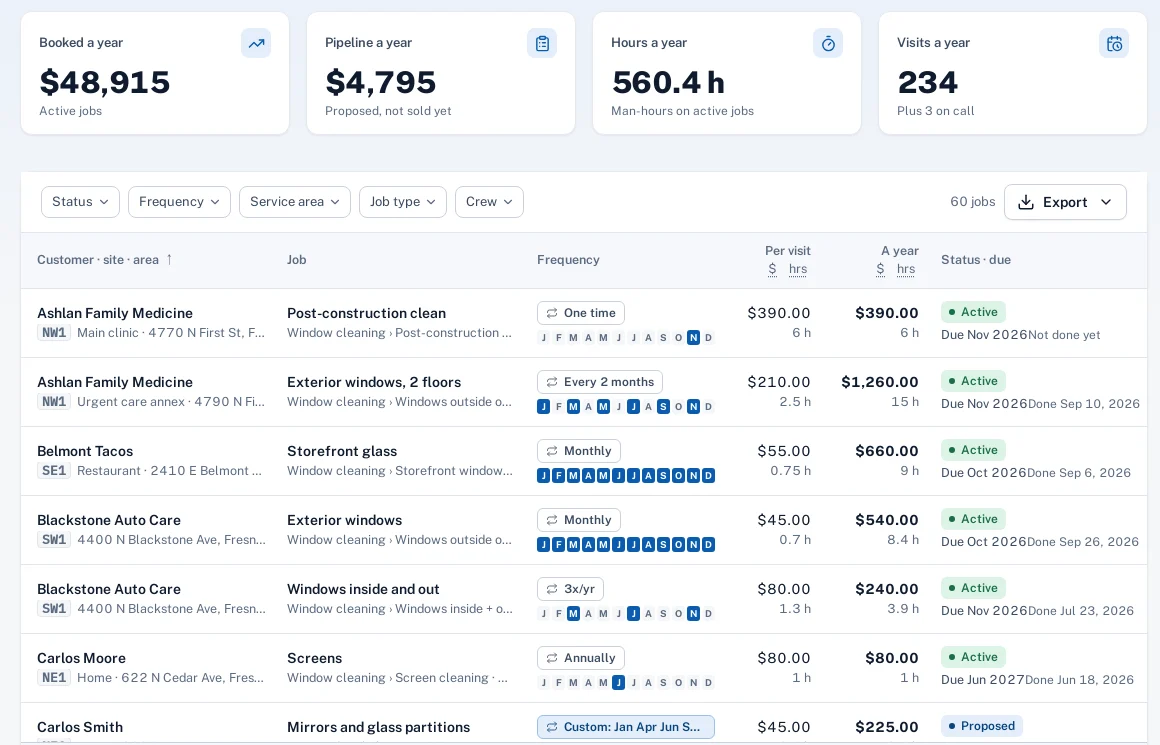
Your recurring jobs add up to hours and revenue for each month. The forecast puts them next to what your crews can work, and the job reports show annual value, forecast against actual, and the prices that are low or old.
Why it matters
The owner knows roughly what the recurring work is worth, but not which months are over-booked or which accounts haven’t had a price change in three years.
In practice
- A window cleaning company. The forecast shows March and October far above crew capacity because the quarterly jobs stack up. The owner moves a few to February and November.
- An HVAC company. Ahead of renewal season, the price review lists maintenance agreements with a low hourly rate or no price change in two years.
How it works
Recurring jobs are the input
Frequency, months, hours and price per visit on each job.
See the next 12 months
Visits, man-hours, man-days and value per month, against your crews’ capacity.
Open a month
The jobs behind it, with customer, service area and man-days.
Check the year
Forecast against what was actually done, and the price review.
Key features
12-month forecast
Visits, hours and value per month from the recurring jobs you have today.
Against crew capacity
Man-days needed next to the man-days your technicians can work, so over-capacity months stand out.
Forecast vs actual
What the jobs said would happen against visits done and hours worked.
Annual value
Booked value by customer, site, service area, job type or crew, with proposed work as pipeline.
Price review
Jobs with a low hourly rate or a price that hasn’t changed in a long time, with the reason each is listed.
Excel export
Every job report downloads as a spreadsheet.
Common questions
Where does the forecast come from?
From your active recurring jobs: their months, hours and price per visit. Proposed jobs show separately as pipeline.
Who can see it?
Owners, admins and the office roles you allow. Technicians never see prices.
Does it include one-off service calls?
Forecast vs actual counts the visits actually done. The forecast itself comes from recurring jobs.